Peer analysis can provide a cross check for the recommendations we derive from more normative analysis. The best peer analyses begin with a narrowly defined population of comparable firms. If the proper care isn’t given to this selection process, the results can prove misleading, as we’ll see in the following example.
The Problem With Too Many Peers
With a hazy recollection of his college statistics course, an analyst may be tempted to improve the “significance” of his analysis by building a larger peer group. This can backfire. Most companies have very few comparable peers — a handful at most — so we are quick to question analyses against larger populations.
Here’s an example of what can go wrong. The question is whether leverage helps or hurts profitability. (We define leverage as Debt/EBITDA; profitability as EBITDA/Sales.) We’ll answer the question by conducting a straightforward univariate regression analysis.
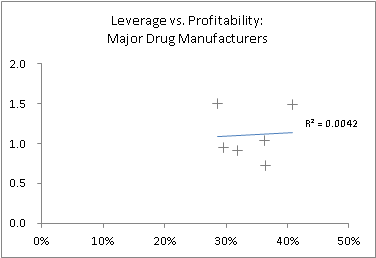
We begin by examining the S&P500 firms classified as “Drug manufacturers – major”, which includes BMY, MRK, LLY, JNJ, PFE, and ABT. We find a positive (albeit weak) relationship between leverage and profitability:
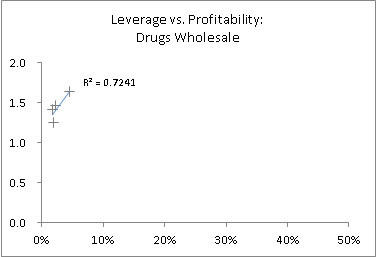
We now repeat for the “Drug wholesale” sector, which includes MHS, MCK, CAH, and ABC:
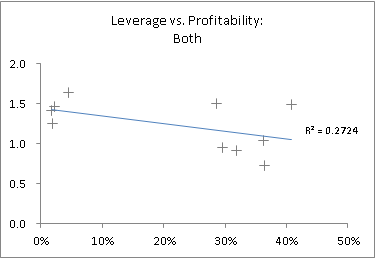
The relationship is still positive. However everything goes pear shaped when we merge the populations:
Caveat analyst.
This is an example of Simpson’s paradox, which is one of many ecological fallacies which can plague statistical analysis of aggregates.


Leave a Reply